
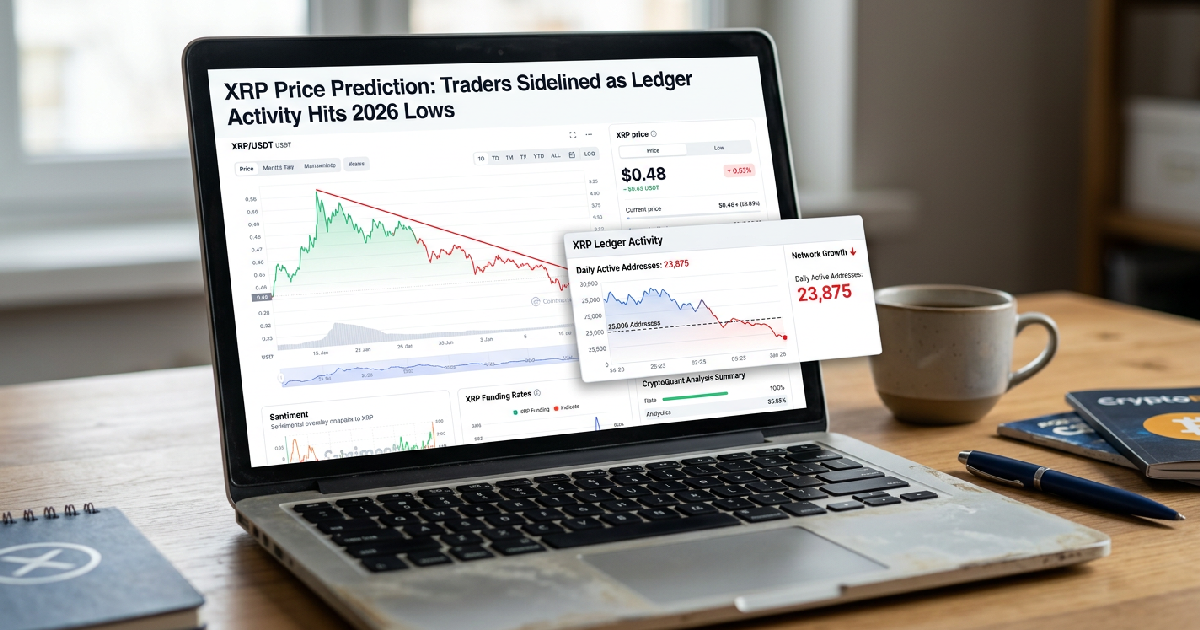

Traders of Ripple’s native digital asset, XRP, are increasingly moving to the sidelines as on-chain activity on the XRP Ledger hits unusually low levels, impacting the XRP price prediction. According to research from Santiment, the network recorded only 25,350 and 24,887 daily active addresses on July 9 and July 10, respectively, signaling a sharp decline in user engagement.
The cryptocurrency is currently trading near $1.09, struggling to find momentum following a year-long technical downtrend. While the asset has seen occasional minor price recoveries, technical indicators such as the spot Cumulative Volume Delta (CVD) suggest that market participants are refusing to chase these shallow bounces, opting instead to wait for a significant move before committing new capital.
Network metrics hit 2026 lows for XRP Ledger
The current lack of momentum is deeply rooted in underlying network data, which shows a marked withdrawal of active participants. Beyond the drop in daily active addresses, the daily network growth—a metric tracking the creation of new addresses—fell to a figure of 2,130.
This represents the lowest growth reported for the XRP Ledger since November 2024, indicating that the ecosystem is failing to attract fresh interest.
This stagnation in user growth often coincides with periods of extended consolidation. The spot CVD for the past 90 days on CryptoQuant remains in neutral territory, hinting at reduced buying pressure since March. While XRP speculative activity briefly surged in May, pushing the price toward $1.55, the flurry of taker buy activity quickly evaporated, leading to a slump back toward the $1.10 support level.
Exchange data confirms a shift in holder behavior, with the exchange net position change turning negative in recent months. Negative values imply that tokens are flowing out of exchanges into cold storage or private accumulation. However, for context, these outflows remain less intensive than the significant accumulation bouts recorded throughout 2025.
Bearish funding rates and the potential for reversal
Despite the prevailing caution, some technical observers see the extreme bearishness as a potential contrarian signal. Analyst Darkfost noted that the 30-day aggregate of funding rates has remained negative throughout 2026. This indicates a firmly bearish speculative bias, even after the market experienced a correction of more than 50% from the July 2025 high of $3.66.
Historically, sustained negative funding rates have occasionally preceded major market shifts. In April 2025, a similar stretch of negative aggregate funding was followed by a 126% price rally. While it remains to be seen if history will repeat, Dogecoin price movement patterns have similarly shown that extreme sentiment often precedes volatility in the broader altcoin market.
For a medium-term reversal to gain traction in the current environment, spot volume trends must undergo a significant shift. The market’s high sensitivity to regulatory developments was previously demonstrated in May 2026, when the CLARITY Act advancing through a Senate committee triggered a 4.5% price jump.
Without a definitive catalyst or a return of aggressive taker buyers, shallow bounces are unlikely to evolve into a sustained recovery.
Critical price levels for sidelined investors
Technically, the token is currently testing critical floors, with immediate support identified near $1.07 and the psychologically significant $1.00 mark. Market data indicates a dense band of buying activity between $1.00 and $1.06, where roughly 830 million XRP last changed hands. A daily close below the $1.00 barrier could potentially open the door for a slide toward $0.80.
Resistance remains heavy on the upside, with bears appearing in the $1.08 to $1.10 range. The 50-day average has capped recent bounces between $1.13 and $1.15, while the horizontal resistance region around $1.22 to $1.28 coincides with the upper boundary of the broader bearish structure.
Traders are also monitoring the $1.18 to $1.20 zone; reclaiming this would be the first signal of a break in the year-long downtrend.
The short-term market structure shows a subtle shift on 4-hour charts after a liquidity sweep below the $1.02-$1.06 support zone, suggesting sellers may be losing temporary control. However, retail and institutional interest remain cautious amid ongoing geopolitical tensions. Until network utility metrics and spot demand align, sidelined traders seem content to watch from the wings.