
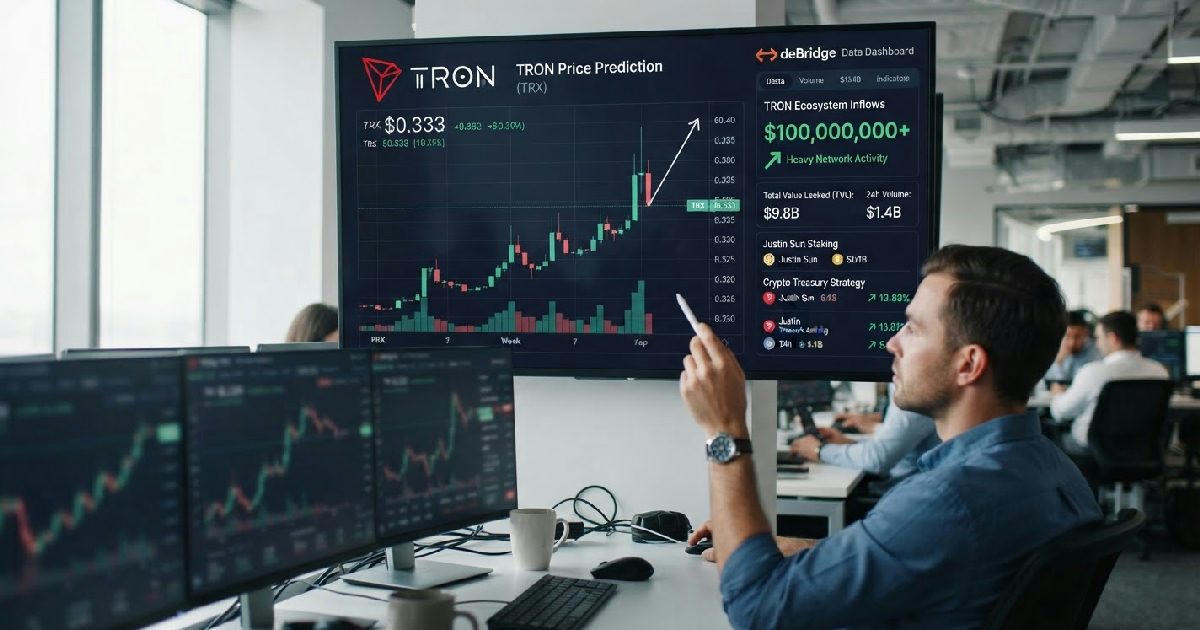

On August 20, 2026, a major TRON price prediction emerged as the native asset TRX consolidated around $0.333, driven by a substantial $100 million ecosystem inflow and aggressive treasury expansion. The network recorded high-volume on-chain activity over the past 30 days, positioning the token for a potential breakout toward the key $0.40 level.
The network’s primary driver stems from decentralized bridge data and strategic corporate buying. Blockchain intelligence shows that more than $100 million was swapped into TRON and its associated stablecoins via deBridge over the last month. This inflow highlights growing interest from capital allocators looking for steady ecosystem yields.
Treasury growth and large transactions anchor TRON demand
Much of this activity reflects a wider market trend where capital is moving toward active layers. In comparison to other protocols experiencing long-term token recovery trends, TRON is benefiting from direct transactional utility. Specifically, the deBridge volume involved 2,241 individual trades with an average transaction size of $44,600.
The single largest deBridge transaction during this period reached $2,000,000, pointing to significant institutional or whale participation. Furthermore, direct TRX purchases represented 32% of that total transaction volume. This high concentration of purchasing power suggests that market participants are actively accumulating the asset.
Simultaneously, the TRON treasury expanded its balance sheet to bolster long-term ecosystem stability. The organization acquired 149,643 TRX tokens at an average price of $0.3341. This strategic transaction successfully pushed the total treasury holdings past 710.6 million TRX.
This corporate treasury behavior mirrors actions by Tron Inc., the Nasdaq-listed entity formerly known as SRM Entertainment. The firm recently launched a massive $100 million treasury strategy, planning to stake its assets through JustLend. That long-term strategy aims for a 10% annual yield.
Technical indicators highlight key TRON price prediction zones
On the technical side, the TRX token is currently maintaining a crucial support level at $0.3224. Buyers have repeatedly defended this price threshold over the last several weeks. This concerted defense has successfully prevented a deeper structural market decline.
If the current buying pressure remains steady, the token could target the immediate resistance level at $0.3387. A clean daily breakout above this barrier would expose a wider weekly supply zone. That supply zone is located between $0.3600 and $0.3688.
These technical moves often align with broader liquidity movements observed across major networks. Similar to how other assets rely on whale tracking metrics to identify local bottoms, TRX traders are monitoring large holder addresses. On-chain metrics indicate that large holder inflows surged 1,269% over the past month.
Fibonacci retracement levels chart the path to forty cents
To evaluate if TRX can realistically reach $0.40, market analysts are closely watching several Fibonacci retracement zones. The price is currently trading around $0.3336, sitting just below the 23.6% Fibonacci level of $0.3355. Reclaiming this first level is necessary to validate immediate bullish continuation.
The next technical obstacle lies at the 38.2% Fibonacci level, which is priced at $0.3525. Clearing this point would confirm that buyers are absorbing localized selling pressure. Beyond that, the 50% midpoint sits at $0.3654, coinciding with the heavy weekly resistance.
If the bulls clear the midpoint, the 61.8% golden-ratio level at $0.3783 comes into focus. This major barrier is comparable to the supply blocks faced during other on-chain liquidity cycles. Passing this golden ratio would open a clear path toward the 78.6% level at $0.3966.
Liquidation heatmaps reveal balanced leverage on both sides
Market leverage data also provides crucial clues about where the token might move next. According to the Binance Liquidation Heatmap, substantial liquidity concentrations exist on both sides of the spot price. The densest cluster of short liquidations is positioned near $0.340.
This high concentration of upside liquidity could act as a magnet for price action. A brief upward squeeze toward $0.340 would help clear the immediate resistance. That move would also pave the way for a test of the higher Fibonacci targets.
Conversely, downside liquidity remains clustered around the $0.326 to $0.327 range. However, this downward pocket is noticeably less dense than the overhead liquidations. This asymmetry suggests that short-sellers face higher immediate risks than long-term spot accumulators.
Despite the positive setup, trend strength indicators suggest that the current move is a gradual climb rather than an explosive rally. The Average Directional Index currently sits at 14.1951, representing a low-trend environment. Consequently, reaching the $0.40 mark will likely require persistent buying over several weeks.
Strategic alignment and the role of Justin Sun
The strategic roadmap for the ecosystem is heavily influenced by TRON founder Justin Sun. Sun joined Tron Inc. as a strategic advisor to guide their corporate treasury deployments. His involvement has increased confidence among institutional participants looking to utilize the network.
Tron Inc. plans to distribute rewards earned from JustLend back to its shareholders as dividends. This approach bridges traditional corporate equity with decentralized finance yields. Such mechanisms could create a repeatable blueprint for other public companies looking to hold TRX.
Currently, market sentiment remains neutral-to-bullish, with the Fear and Greed Index sitting at 46. While this indicates general caution, technical indicators show a 70% bullish sentiment. This divergence suggests that the market has not yet fully priced in the recent inflows.