
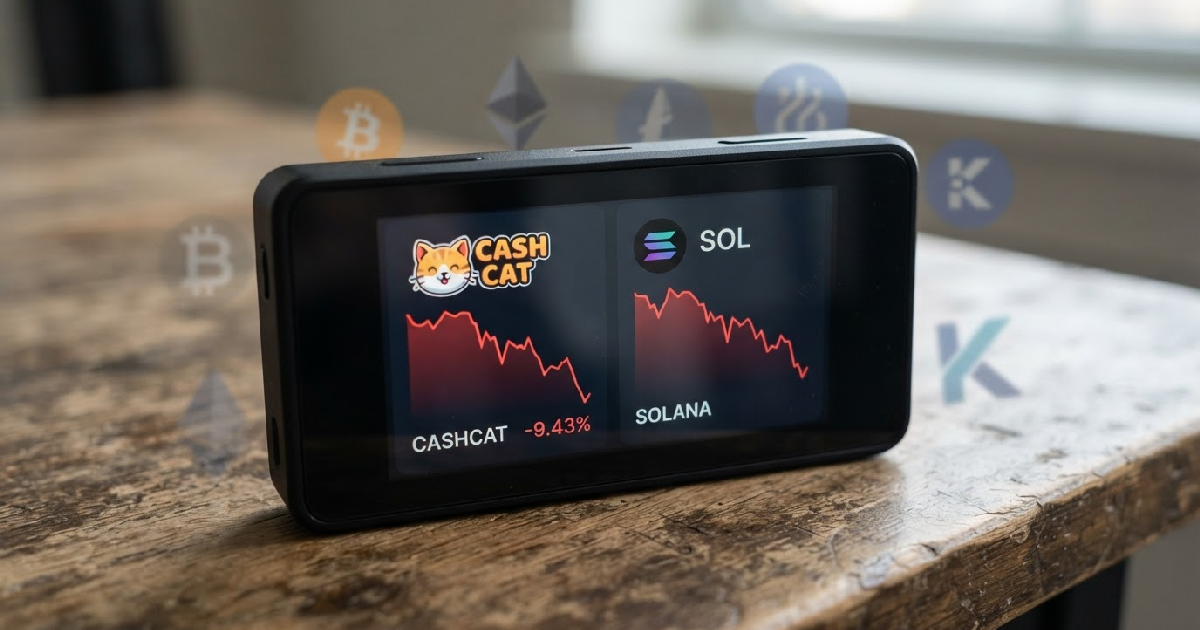

Recovery momentum for several prominent cryptocurrencies, including meme coin sensation Cash Cat (CASHCAT) and established assets Solana (SOL), XRP, and Dogecoin (DOGE), appears to have largely dissipated as of July 24, 2026.
Despite earlier hints of stabilization or attempted breakouts, market data shows persistent selling pressure and dwindling buyer enthusiasm, pushing prices lower or maintaining them within constricted bearish ranges. The prevailing sentiment indicates that any “recovery hype” from recent periods has largely run its course.
Cash Cat’s Post-Launch Decline Continues
Cash Cat, which experienced a meteoric rise following its launch, now finds itself entrenched in a steep downtrend. Solana is navigating a period of attempted stabilization but faces significant overhead resistance. Meanwhile, XRP’s recent breakout attempt was swiftly rejected, and Dogecoin continues to exhibit a notable weakness compared to its large-cap peers, underlining a challenging environment across varied segments of the crypto market.
Cash Cat (CASHCAT), a token that once garnered significant attention with a spectacular launch rally, is currently trading at approximately $0.046 on July 24, 2026. This figure marks a substantial retreat from its initial surge, which saw the token approach the $0.20 region. The daily charts paint a clear picture of seller dominance, with speculative buying pressure having all but vanished from the market.
Significantly, CASHCAT failed to establish any meaningful consolidation after its initial ascent. Instead, it has settled into what analysts describe as a textbook downtrend, characterized by successive lower highs with each attempt at recovery. The most recent candle sequences further reinforce this pattern, demonstrating that buyers couldn’t even sustain a brief push towards the $0.08 mark.
The absence of accumulation following the initial collapse stands out as one of the most concerning features for the meme coin. Typically, violent sell-offs in strong meme assets are followed by protracted periods of sideways trading, allowing new buyers to gradually enter the market. Cash Cat hasn’t exhibited this behavior, instead continuing to print lower lows.
Daily volatility has also progressively decreased, signaling a broader decline in activity from both buyers and sellers alike. Momentum indicators reflect this bearish outlook, with the Relative Strength Index (RSI) sitting at 41. While this reading is no longer considered oversold, it certainly shows no signs of a bullish resurgence.
A move back above the neutral 50 level on the RSI would be necessary to signal any potential for a long-term reversal. Until then, every bounce carries the risk of turning into just another brief relief rally. The primary resistance zone for CASHCAT is now identified between $0.06 and $0.08.
This range previously served as short-term support before its sharp breakdown. Sellers are likely poised there, ready to offload positions if the price approaches these levels. On the downside, the current lows around $0.045 are becoming increasingly crucial for establishing any floor.
A decisive break below these levels would expose Cash Cat to a fresh wave of price discovery towards lower valuations, given the token’s lack of historical support beneath this range. Despite occasional long upper wicks indicating fleeting speculative buying, the overall technical structure remains unequivocally bearish.
Solana Attempts Stabilisation Amidst Overhead Resistance
After enduring months of pronounced weakness, Solana (SOL) is showing signs of attempting to stabilize, trading at approximately $76 on July 24, 2026. The asset has progressively begun to form a string of higher lows, offering a glimmer of improvement from June’s steep decline, which saw its price dip into the low-$60 area. However, heavy overhead resistance continues to cap its broader trend.
One of the more promising developments lies in the relationship between SOL’s price and its shorter moving averages. Solana has successfully reclaimed both the 26-day and 50-day exponential moving averages, which are now acting as dynamic support levels. For several sessions, the price has been consolidating above these benchmarks, suggesting that buyers are actively protecting recent gains rather than immediately taking profits.
Despite these positive technical shifts, the wider picture for Solana remains challenging. The 100-day EMA, currently positioned near $80, has consistently acted as a barrier, rejecting upward attempts throughout July. Higher still, the 200-day EMA at $93 continues its downward slope, a stark reminder that the longer-term trend has yet to return to bullish territory.
The current consolidation around the $76 mark could prove beneficial for Solana. This sideways movement allows the underlying moving averages to compress below the price, rather than extending vertically into resistance. Such a setup often lays the groundwork for a more forceful breakout attempt, should buying volume eventually re-emerge in the market.
Momentum indicators align with this interpretation. The RSI is currently near 51, indicating a nearly neutral state. This suggests that momentum has rebounded from negative conditions without yet becoming overheated, leaving room for further upward movement before entering overbought territory. Still, traders will likely wait for a discernible increase in buying activity before anticipating a clear breakout.
The immediate resistance zone for Solana is concentrated between $80 and $84. This critical area is where the declining 100-day EMA intersects with earlier horizontal resistance levels. A sustained push beyond this range would be necessary to instil greater confidence among investors. Reaching the psychologically significant $90 area would likely trigger a resurgence of broader optimism for the asset.
On the support side, the shorter moving averages are now converging between $73 and $74, indicating a strengthening base. However, a loss of this crucial area would weaken the recent recovery, potentially sending SOL back down towards the mid-$60 range.
While Solana’s technical picture has significantly improved compared to earlier this summer, developing a positive base and exiting its freefall, its recovery remains an “improving consolidation” rather than a confirmed long-term uptrend until the $80–$84 resistance zone is firmly breached.
XRP Struggles to Maintain Breakout Momentum
XRP has encountered significant headwinds in its most recent attempt to break out, with sellers swiftly intervening to drive the asset back down. After briefly pushing above the upper boundary of its ascending triangle, XRP was rejected, suggesting that buyers are still not sufficiently convinced to counteract the prevailing downward trend. As of July 24, XRP is trading at approximately $1.13.
This price point places it almost precisely where several short-term moving averages converge. The 26-day exponential moving average currently serves as immediate resistance, while the 50-day and 100-day moving averages sit higher, between $1.16 and $1.24. Together, these form a dense supply zone that is likely to restrict any significant upside movement until XRP can decisively clear this cluster.
Following the unsuccessful breakout, the daily RSI has retreated below the neutral 50 level, signaling waning momentum among bulls. Moreover, trading volume has remained comparatively muted, indicating that attracting new capital has proven difficult for buyers. This lack of robust participation further underscores the challenges XRP faces in building sustainable upward pressure.
On the downside, the rising trendline that underpinned the most recent consolidation remains a critical level to monitor. A decisive daily close below this trendline, especially if it falls beneath the psychological support at $1.00, could invalidate the entire recovery structure that has been in development. Such a move would expose XRP to another potential decline, possibly towards the $1.05 area.
Conversely, reclaiming the $1.16 level would provide a much-needed boost of confidence for market participants. This would not only restore access to the 50-day moving average but also signal a potential shift in short-term sentiment. However, the immediate challenge lies in overcoming the current selling pressure and the established resistance levels.
Dogecoin’s Persistent Technical Weakness
Dogecoin (DOGE) continues to exhibit substantial weakness when compared to the majority of large-cap cryptocurrencies, trading near $0.070 on July 24, 2026. Positioned just above its recent local lows, the meme coin remains well below all of the major moving averages on its daily chart, offering little room for optimism in its current technical structure.
The 50-day, 100-day, and 26-day moving averages are all trending above Dogecoin’s price, unequivocally indicating that sellers maintain control across all significant timeframes. Unlike XRP, which attempted a breakout, DOGE has largely been grinding sideways after a protracted decline, failing to establish any convincing higher-low pattern that would suggest a foundational recovery.
Momentum indicators further reflect this pervasive weakness. The RSI for Dogecoin is currently below 40, a clear sign of persistent bearish momentum. Importantly, this reading has not yet reached extremely oversold levels, implying that if selling pressure intensifies, there remains significant room for an additional leg lower. This suggests a lack of robust buying interest even at these suppressed prices.
Furthermore, trading volume has decreased significantly compared to the peaks observed during earlier rallies, indicating that speculative interest in Dogecoin has essentially evaporated. In the absence of fresh demand, any recovery efforts are likely to be met with selling, as existing holders seek to exit positions or take profits from minor bounces.
The immediate obstacle for buyers lies in recovering the 26-day EMA, currently at $0.075.
Beyond this initial hurdle, stronger resistance emerges closer to the 50-day moving average, positioned around $0.078. If Dogecoin fails to maintain its current trading range, a move towards the psychological $0.065 level becomes a distinct possibility. Such a decline would represent yet another major setback in its long-term structure, reinforcing the view that DOGE currently possesses one of the weakest-looking charts among major cryptocurrencies.