
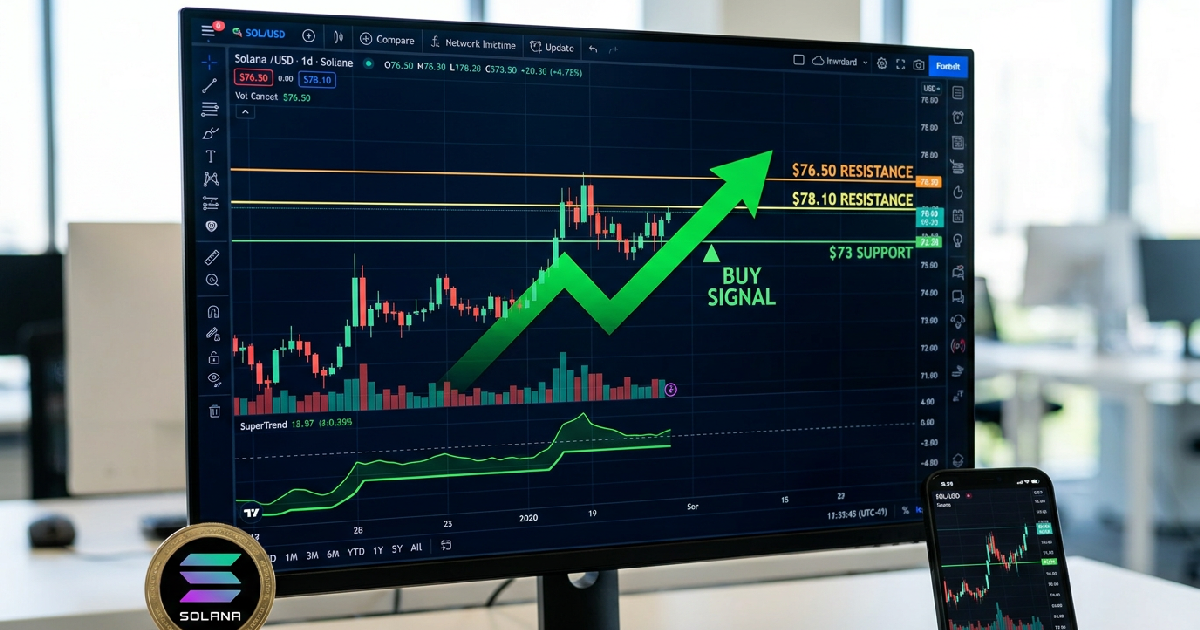

Solana (SOL) recently activated a significant “buy signal,” marking a potential shift in sentiment for the popular cryptocurrency. As of mid-July 2026, SOL is trading between $76.50 and $78.10. It’s now navigating a complex landscape of technical resistance levels that could impede its upward trajectory and challenge hopes for a sustained recovery.
This development arrives as the asset experiences some upward momentum, bouncing 16% over the past week. Solana has managed to hold the $73 support level. However, a break below $75.20 would weaken this recovery, potentially exposing the demand zone around $63 or the June lows of $60-$65.
Understanding Solana’s technical signals
A SuperTrend buy signal was activated on June 30, 2026, after Solana broke above $78. This event represents the first such signal for SOL since October 2025, suggesting a potential shift towards buyers. Crypto analyst Ali Martinez highlighted this SuperTrend flip, noting that the Average True Range (ATR) Trailing Stop moved below the SOL price.
The SuperTrend indicator is a trend-following technical analysis tool developed by Olivier Seban. It identifies market direction and generates clear buy or sell signals. A bullish trend signal occurs when the price closes above the SuperTrend line, which typically appears below the price.
Conversely, a bearish trend is indicated when the price falls below it. The indicator uses Average True Range (ATR) to measure volatility. This helps define the dynamic stop-loss level and sensitivity of the signal.
Current technical indicators paint a picture of cautious neutrality for Solana. Its 14-day Relative Strength Index (RSI) stands between 52.83 and 54.2. This reading suggests a balanced market. A sustained move above 60 would indicate stronger bullish momentum, signaling increased buying pressure.
Key resistance zones test upward movement
Despite the encouraging buy signal, Solana faces a dense network of overhead resistance that poses a significant challenge to any substantial recovery. Resistance levels are price points where an asset typically encounters selling pressure. This prevents further upward movement. At these levels, sellers often outnumber buyers, causing momentum to stall or reverse.
The most immediate hurdle for SOL lies between $79 and $85. Approximately 105 million SOL tokens changed hands within this range in the past. This historical trading activity creates a substantial supply zone. Existing holders might sell to break even, intensifying selling pressure on price rallies.
Breaking the $80 mark is crucial for Solana’s recovery efforts. Data from Polymarket indicates a 75.9% probability of SOL hitting $80 in July. This reflects some cautious market optimism.
Yet, the 100-day Exponential Moving Average (EMA) at $80.99 also acts as a notable resistance point. This EMA could cap further gains if buying volume isn’t sufficient. These types of moving averages are watched closely by traders.
The path to a more robust recovery demands reclaiming the wider resistance zone between $82 and $94. This area incorporates several prior price points that have historically limited upward moves. Failure to move past these levels would likely keep Solana’s current bearish swing structure intact, maintaining selling pressure.
Broader resistance levels and a look ahead
Further out, a major weekly resistance level exists at $98, a price that has rejected Solana multiple times throughout 2026. A decisive weekly close above this level would signal a significant bullish shift for the asset. This remains a key psychological and technical barrier for investors eyeing a sustained turnaround.
Beyond these immediate challenges, the 200-day EMA at $94.82 represents another critical level. Solana’s broader bullish trend won’t be confirmed until it manages to trade decisively above this moving average. This long-term indicator is often seen as a benchmark for asset health, signaling conviction among buyers.
Reaching the 0.618 Fibonacci level at $120 would require a substantial gain of over 55% from current price levels. Fibonacci retracement levels are a technical analysis tool used to identify potential support and resistance points. Achieving such a significant increase would be a demanding climb given the present market conditions and current resistance.
Solana’s current position highlights a tug-of-war between nascent bullish momentum and entrenched resistance. While the buy signal and recent price stability offer a glimmer of hope, the sheer volume of SOL tokens held within the $79-$85 range suggests caution. This, coupled with other key technical barriers, indicates that any significant upward movement will likely require considerable buying pressure and broader market support. Investors will need to see decisive breaks above these critical resistance levels for sustained growth.