
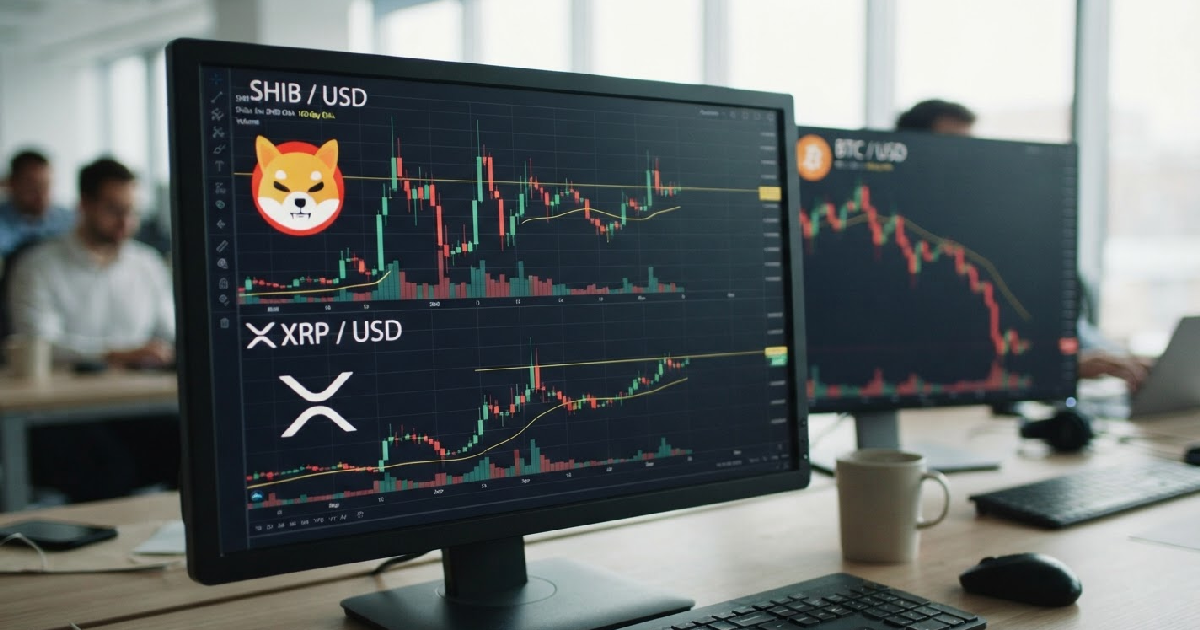

The cryptocurrency market stands at a critical juncture today, August 4, 2026, as major digital assets navigate significant technical challenges. Shiba Inu (SHIB) is testing its 100-day exponential moving average (EMA), a level historically proven to be a tough ceiling during market downturns. XRP, meanwhile, has hit a crucial resistance zone after a recent recovery attempt.
Adding to the uncertainty, Bitcoin (BTC) shows renewed signs of weakness, with its recent recovery bid beginning to falter. This collective struggle highlights a broader market sentiment where earlier bullish momentum has faded more quickly than many expected, according to an analysis by Arman Shirinyan for U.Today.
Shiba Inu’s decisive test at 100-day EMA
Shiba Inu has staged an impressive short-term comeback, rallying from local lows with a significant increase in buying volume. This surge allowed the meme coin to climb above its 26-day and 50-day exponential moving averages, which have now begun to level off. This could signal a potential shift in its market structure.
But the most formidable obstacle remains the 100-day EMA, currently positioned at $0.00000500. While buyers remain active, SHIB’s price is consolidating directly beneath this resistance, without a clear breakout. The asset’s Relative Strength Index (RSI) has also cooled towards the high 50s, indicating that initial overbought conditions have eased without causing a major sell-off.
Volume will dictate SHIB breakout potential
A successful daily close above the 100-day EMA at $0.00000500 would be more than just another resistance break. It would mark a crucial shift towards a more optimistic market structure for Shiba Inu. Such a move could encourage momentum traders, potentially pushing the price towards the long-term 200-day EMA, which remains significantly higher despite trending downward.
The crucial factor for this potential breakout is sustained trading volume. While a recent rally saw a dramatic increase in buying activity, follow-through buying has been less consistent. Renewed high-volume buying pressure dramatically increases the likelihood of SHIB overcoming this resistance. However, a failure at current levels would likely send the price back towards the 50-day EMA, now its first significant support.
Losing that 50-day EMA support could invalidate the developing bullish structure. This would transform the recent rally into another brief ascent within a larger bearish trend. Pseudonymous analyst SHIBMortal noted on July 31 that “The floor seems to be holding (so far). We are not out of the woods yet,” describing the bounce as promising but emphasizing SHIB was still testing resistance.
As of August 4, 2026, Shiba Inu trades at $0.00005499, marking a 7.70% increase over the last seven days. It’s outperforming the global cryptocurrency market. Its daily trading volume sits at $90,135,680, a 5.90% decrease from the previous day. The most active trading pair on OKX is SHIB/USDT, with a volume of $2,416,524 in the last 24 hours.
XRP’s recovery attempt reaches resistance ceiling
XRP has also made a recovery attempt, rising from recent lows around the $1.00 support area after weeks of persistent weakness. This bounce, marked by a discernible increase in volume, initially looked encouraging. It even formed a small ascending triangle.
However, XRP’s upward momentum soon lost steam as it approached a moving-average cluster, the crucial resistance zone currently around $1.10. This area combines past price congestion with the declining 50-day and 100-day moving averages. These averages have consistently rejected bullish advances during the broader downtrend, acting as a formidable ceiling.
Momentum indicators show hesitation for XRP
Technically, XRP finds itself in an unclear position, stuck below the declining 100-day EMA. The long-term 200-day moving average, still at $1.40 and sloping downwards, highlights the continued dominance of sellers in the overall market. Momentum indicators also reflect this hesitation, with the Relative Strength Index hovering around the neutral 45-46 range.
This RSI reading indicates that while buying pressure has improved from oversold conditions, it hasn’t generated enough strength for a strong bullish trend. Unlike some other large-cap cryptocurrencies, XRP hasn’t pushed its RSI above the 50-mark into bullish territory. A decisive daily close above the $1.10 resistance zone would significantly improve XRP’s outlook, potentially setting its sights on the 200-day EMA.
Failure to break this resistance, however, risks a retreat back to the psychological $1.00 support. A breach of that level would invalidate much of the recent recovery, leaving XRP vulnerable to further declines. As of August 4, 2026, XRP has seen a 1.80% price increase in the last seven days, with a daily trading volume of $938,390,603, marking a 19.60% increase from one day ago.
Bitcoin’s weakening trend raises fresh concerns
Bitcoin, the market’s largest cryptocurrency, is also displaying renewed signs of weakness, with its attempt to recover starting to falter. The cryptocurrency had recovered several short-term moving averages after rising from its June lows. But those gains are now under threat as Bitcoin struggles to stay above the 50-day exponential moving average.
The market has entered another phase of uncertainty, with Bitcoin trading around $63,000, caught between immediate support and resistance levels. It has struggled to maintain its position above the 50-day EMA. Every subsequent recovery attempt has consistently resulted in lower highs, indicating sellers are regaining control.
Long-term resistance remains Bitcoin’s challenge
The broader technical structure poses a significant challenge for Bitcoin. The 100-day EMA currently sits around $67,000, and the 200-day EMA is still trending lower at approximately $72,000. These long-term resistance levels remain well above the current price. They reinforce a bearish overall market structure despite intermittent relief rallies over the past two months.
Trading volume also points to increased uncertainty. While there was significant buying pressure when Bitcoin recovered from its June lows, participation in recent sessions has decreased. This lack of fresh inflows makes it increasingly difficult for bulls to overcome the formidable resistance formed by the declining moving averages.
From a technical standpoint, immediate support for Bitcoin is found in the $60,000-$61,000 range. A collapse below this critical zone could lead to another test of the June lows, potentially triggering a more widespread sell-off across the digital asset market. Conversely, regaining the 100-day EMA would require first breaking through the 50-day moving average, a move that would significantly enhance market sentiment.
Technical indicators point to a critical period ahead
The current crypto market landscape is defined by a pervasive sense of caution, despite the individual rallies seen in SHIB, XRP, and BTC. The bullish momentum across these assets has dissipated more quickly than many market participants anticipated. This has turned recent gains into tests of resilience at crucial technical junctures. These individual struggles reflect a broader sentiment where sellers continue to exert pressure.
The collective performance of these assets underscores the fragile nature of the current market. Shiba Inu grapples with its 100-day EMA, XRP struggles to break its recovery ceiling, and Bitcoin shows signs of renewed weakening. Investors are keenly watching whether key resistance levels can transform into new support, or if these assets will retreat to retest their recent lows.
The importance of sustained buying volume cannot be overstated for all three cryptocurrencies. Without a significant influx of capital and renewed participation, the likelihood of breaking critical resistance levels diminishes considerably. This period serves as a crucial indicator of whether recent bounces were merely temporary relief within a larger downtrend or genuine precursors to a more robust recovery.
SHIB’s liquidation map, reported on July 31, highlights further immediate risks. Significant leverage clusters sit below the market, particularly around $0.00000450 to $0.00000452. Losing the $0.0000046 floor could trigger further leveraged long liquidations. Upside liquidity for SHIB remains scattered, with meaningful bands near $0.0000048 and $0.0000049, before a larger cluster around the critical $0.0000050 level.