
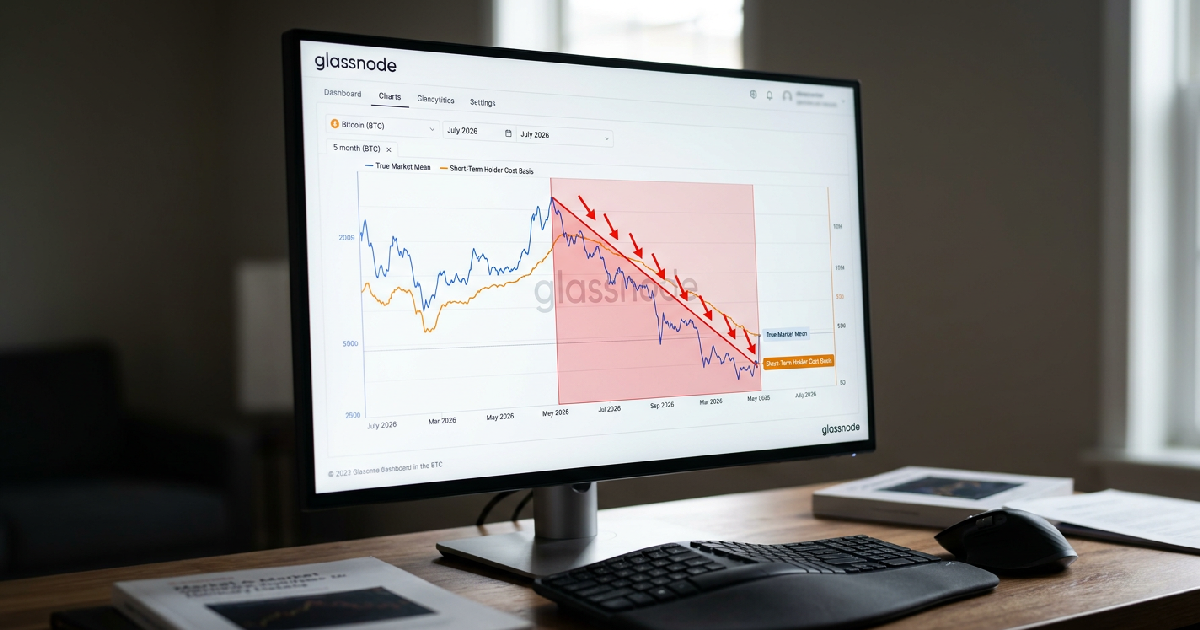

Bitcoin is currently navigating a “bottom building” phase as long-term holder capitulation signals a late-stage bear market, according to the latest on-chain intelligence from Glassnode. The research, published July 9, 2026, reveals that the digital asset has traded below its True Market Mean and Short-Term Holder Cost Basis for five straight months, marking one of the longest “deep-value” stretches in its history.
Analysts identify the exit of veteran investors as a core driver of current price stagnation. Long-term holder loss realization now accounts for 43% of the total realized value on-chain, a sharp increase from 15% in early February. This exodus peaked recently at $280 million in daily realized losses, the highest level recorded since December 2022.
Long-term holder capitulation creates persistent price ceiling
While investor sentiment continues to shift, these realized losses represent a significant exhaustion of conviction among those who bought near previous cycle peaks.
The on-chain data highlights long-term holder (LTH) capitulation as the single largest source of downward pressure on Bitcoin. Investors who held through months of drawdown are increasingly exiting as the bear market extends beyond their individual pain thresholds. This cohort has met every attempted price recovery with “fierce distribution,” preventing Bitcoin from reclaiming the upper end of its current trading range.
Glassnode analysts note that the Entity-Adjusted Long-Term Holder Realized Loss metric, which is smoothed on a 30-day basis, has not yet cooled significantly from its recent peak. A sustained compression in this specific metric is considered a mandatory precondition for a credible shift toward a bull market.
Until this selling pressure subsides, the market remains structurally vulnerable to further downside, potentially testing the realized price near $53,000.
As of Thursday, Bitcoin traded below $63,000, having spent the week bouncing between approximately $58,300 and $64,400. This price action remains well below the True Market Mean of $76,600 and the Short-Term Holder Cost Basis of $72,200. These metrics are critical because they define the “deep-value territory” where historical bottoms often consolidate before a trend reversal.
Institutional ETF flows and derivatives show signs of cooling
Institutional demand remains fragile, though the rate of capital flight appears to be slowing. The 30-day average of spot Bitcoin exchange-traded fund (ETF) net flows peaked at negative $193 million per day in early June but has since eased to roughly negative $89 million per day.
However, liquidity remains thin, with daily ETF trading volumes sitting roughly 80% below the $4.4 billion peak recorded in October 2025.
The sluggish institutional activity in Bitcoin mirrors broader trends where Ethereum navigates institutional outflows and technical support levels. Interestingly, derivatives traders are taking a more contrarian view. The options open-interest put/call ratio fell to 0.56, its lowest reading of 2026, suggesting a de-risked market leaning cautiously long.
Despite this, the 25-delta skew remains elevated at 24%, indicating that traders are still paying a premium for downside protection.
On July 8, spot Bitcoin ETFs recorded $84.86 million in net outflows. In contrast, spot Ether ETFs posted $70.48 million in net inflows on the same day, marking their fifth consecutive day of positive growth. QCP Capital noted that while some ETFs like IBIT, FBTC, and ARKB saw positive sessions recently, further consistency is required to confirm a durable institutional recovery.
Macroeconomic shocks and geopolitical volatility impact risk assets
The bottoming process faced a fresh disruption this week due to escalating tensions in the Middle East. President Trump announced on Wednesday that the U.S.-Iran memorandum of understanding had lapsed, sending WTI crude oil 7.9% higher over seven days. Following Iranian strikes on commercial vessels, U.S. Central Command retaliated by hitting roughly 90 targets across two rounds of strikes on Wednesday and Thursday.
Bitcoin’s performance has been tightly correlated with broader risk assets during this period. While the asset rose as much as 9.4% earlier in the week, it pared those gains to 5% as the S&P 500 and Euro Stoxx turned negative.
QCP Capital warned that monetary policy offers no cushion, citing June payrolls that rose by only 57,000 — approximately half of the 110,000 expected by the market.
This economic cooling occurs as inflation remains a binding constraint. U.S. M2 money supply pushed to a record $22.8 trillion in May, and wage growth remains at 3.5% ahead of the July 14 CPI print.
With the Strategic Petroleum Reserve at its lowest level since 1983 and private credit funds like Blackstone and Apollo breaching redemption gates, analysts are closely watching for the “first crack” in the global financial system.
Technical support levels and the path to recovery
Technical analysts are focused on the low $60,000 region as the most critical support zone. Daniela Hathorn of Capital.com identified the mid-$60,000s as the primary resistance level to watch, followed by the prior swing highs near $70,000. If Bitcoin fails to maintain its current support, the risk of a breakdown toward the $53,000 realized price increases significantly.
The crypto market’s resilience is also being tested by individual firm actions; Strategy reportedly sold Bitcoin for the first time to fund dividend payments, adding to the local supply overhang. While the current environment is difficult, assessing market resistance is essential for predicting the next leg of the cycle.
Glassnode concludes that while bottoming conditions are in place, a sustained reclaim of the True Market Mean is the only signal that will confirm a regime shift.