
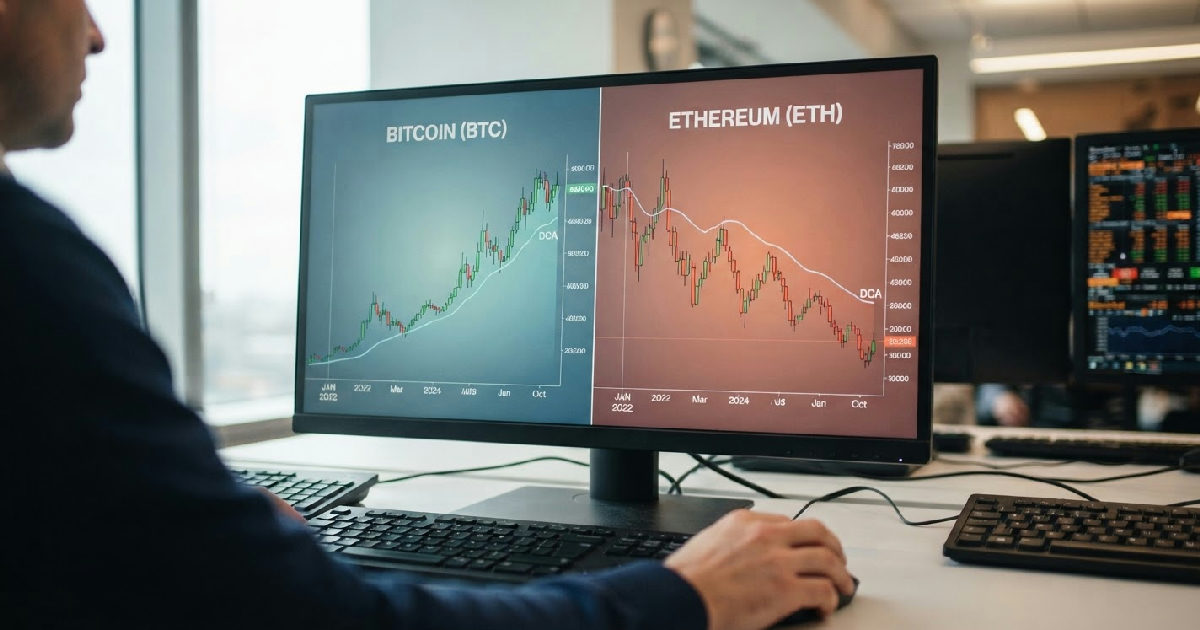

Investors who consistently applied a dollar-cost averaging (DCA) strategy to leading cryptocurrencies since January 2022 have seen wildly divergent results. While assets like Bitcoin, XRP, Solana, and Tron delivered substantial returns by August 2026, Ethereum and Cardano buyers found themselves facing significant losses despite their disciplined approach, according to new data from CryptoRank.
This stark performance gap highlights a crucial lesson for crypto investors: DCA, while mitigating volatility, doesn’t guarantee profit. Its effectiveness hinges deeply on an asset’s ability to recover and the broader market dynamics that have reshaped the digital asset landscape over the past few years.
Crypto dollar-cost averaging performance since January 2022
The CryptoRank analysis simulated a straightforward investment: $100 placed into a single cryptocurrency every month from January 2022 through August 2026. This consistent buying pattern meant a total capital contribution of $5,600 for each asset over the period.
The outcome varied dramatically. Tron (TRX) emerged as the undisputed leader, with the $5,600 investment swelling to an impressive $16,521, representing a 195% return. Bitcoin, XRP, and Solana also generated robust profits for long-term DCA investors.
Bitcoin yielded a portfolio value of $8,660, XRP $8,465, and Solana $8,025. These three digital assets each provided gains exceeding 40% on the initial $5,600 contribution. Such figures underscore the potential for systematic buying to capture upside, even in a volatile market.
However, the strategy proved less forgiving for other major cryptocurrencies. An investor applying the same $100 monthly DCA to Ethereum would have seen their $5,600 contribution dwindle to approximately $4,898, marking a 12.5% loss.
Cardano (ADA) faced an even harsher reality. The identical $5,600 investment in ADA resulted in a portfolio worth just $2,616, reflecting a substantial 53.3% loss. These contrasting results challenge the common perception that DCA is a foolproof method for navigating crypto markets.
The pivotal 2024 rally and its market shifts
Most of the gains for the top-performing assets were accrued during the powerful crypto rally of 2024. Portfolios built through consistent buying over the preceding two years saw their values surge dramatically as market sentiment improved.
By the close of 2024, the hypothetical Solana portfolio had peaked at an impressive $17,728. XRP’s value hit $14,345, Bitcoin reached $10,193, and even Cardano briefly touched $7,251, showing profitability for all assets at that point.
This rally was heavily influenced by crucial regulatory advancements in the United States. The Securities and Exchange Commission (SEC) approved spot Bitcoin exchange-traded products in January 2024, followed by spot Ethereum products in May 2024.
These approvals provided regulated avenues for institutional investors to gain exposure to the two largest digital assets, injecting new capital and confidence into the market. It was a significant moment for mainstream adoption.
Market momentum further intensified after Donald Trump’s victory in the November 2024 presidential election. His campaign pledges to position the US as a global crypto hub, coupled with promises to replace SEC Chair Gary Gensler, whose enforcement-focused approach had drawn industry criticism, fueled investor optimism.
Post-election, President Trump’s administration delivered on parts of that agenda. It established a Strategic Bitcoin Reserve and a US Digital Asset Stockpile. He also signed the GENIUS Act, creating a federal regulatory framework for payment stablecoins.
These policy shifts, combined with renewed investor confidence and the approval of spot Bitcoin ETFs, helped push cryptocurrency ownership in America back to 30% in 2026. Bitcoin itself reached repeated record highs as traders bet on a more favorable regulatory environment.
Post-rally reversals and continued divergence
The subsequent market downturn, however, erased much of the wealth those recurring buyers had accumulated, particularly for some assets. This reversal highlighted the temporary nature of some gains during the 2024 peak.
Solana’s portfolio, for instance, dramatically fell from its peak of $17,728 at the end of 2024 to $8,025 by August 2026. This represented a substantial decrease of $9,703, or nearly 55%, even as the investor continued adding $100 every month.
XRP also saw its value drop significantly, falling by $5,880 from its 2024 level to $8,465 by August 2026. Cardano surrendered $4,635 from its 2024 high, finishing at a mere $2,616 by August 2026.
For Cardano, the severity of this reversal was profound. It turned what had been a profitable position at the end of 2024 into a 53.3% loss on the full $5,600 invested by August 2026, demonstrating the fragility of unrealized gains.
Bitcoin proved more resilient through this period. Its portfolio value rose further to approximately $10,800 in 2025 before retreating to $8,660 this year. Ethereum followed a similar path, reaching $6,501 in 2025 before falling to $4,898.
Notably, Ethereum’s final value of $4,898 landed it below the investor’s cumulative contributions, indicating that its recovery wasn’t strong enough to offset the earlier downturns. It also reduced the value of assets held by US crypto ETFs.
SoSoValue data shows the market has fallen from more than $123 billion during its expansion to roughly $92 billion as crypto prices declined. Bitcoin ETFs alone now hold about $78.3 billion, while Ethereum products hold roughly $10.6 billion.
Tron (TRX) stood out as a clear exception to the post-rally declines. Its DCA portfolio consistently increased at every annual snapshot, climbing from $1,000 in 2022 to $3,679 in 2023. It then surged to $11,032 in 2024, $13,723 in 2025, and ultimately $16,521 by August 2026.
Solana’s resurgence and Cardano’s market cap slide
Solana’s ability to end in profit, despite significant volatility, offers a compelling case study for DCA. Its token remained approximately 59% below its early-2022 price of $170 by August 2026, yet the monthly investment was still up 43.3%.
This positive outcome is largely because buyers who continued purchasing through its post-FTX collapse, when it traded below $10, accumulated far more tokens before the subsequent rebound. Its strong recovery from those lows fundamentally shifted the average cost basis.
Solana’s underlying strength also played a role, benefiting from faster transaction speeds and lower fees compared to Ethereum. Its thriving ecosystem of NFT projects and decentralized finance applications has helped maintain investor interest and adoption.
Conversely, Cardano’s struggles are reflected in its market standing. The asset dropped out of the top 10 largest cryptocurrencies by market capitalization. Its market cap stood at around $12.3 billion as of July 30, 2026.
Tron (TRX), with its consistent performance, effectively replaced Cardano to become one of the top 10 largest cryptocurrencies by market capitalization. This shift underscores how rapidly fortunes can change in the competitive crypto landscape.
Recent performance data from July 2026 showed a mixed outlook. Ethereum gained 16%, Cardano gained 15%, Bitcoin surged past $66,000 (up 15% from July lows), XRP gained 2.5%, and Solana gained 12%. However, looking back three months to July 30, Solana was down 40%, Ethereum down 28%, Bitcoin down 22%, and XRP down 34%, indicating persistent headwinds.
The double-edged sword of DCA in crypto
The performance review since 2022 illustrates that while crypto dollar-cost averaging performance can significantly mitigate the impact of poor entry prices, it isn’t a universal shield against losses. The strategy effectively reduced the damage for assets like Ethereum and Cardano.
Ethereum’s token price was roughly 50% lower in early August 2026 compared to early 2022, yet the DCA portfolio lost only 12.5%. Similarly, Cardano’s ADA fell about 85% from $1.38 to $0.20, while the recurring investment lost 53.3%.
Buying through these declines lowered the investors’ average cost. It wasn’t enough to return the positions to profit, but it demonstrably softened the overall losses, confirming DCA’s role in smoothing out extreme price movements.
However, TRX demonstrated the strategy’s other side. The token climbed from roughly $0.075 at the beginning of 2022 to about $0.33 by August 2026, a gain of more than 300%. The DCA portfolio, by contrast, returned 195%.
Because each successive $100 purchase bought fewer tokens as TRX appreciated, recurring purchases captured less of the extreme upside than deploying the same capital earlier would have. This shows DCA can limit gains in consistently rising markets.
Ultimately, the effectiveness of the crypto dollar-cost averaging performance strategy is most pronounced when prices collapse and later recover strongly. It reduces losses in declining markets and can transform poor starting points into profitable positions, as seen with Solana. However, it also limits the maximum gains available from assets that rise steadily without major pullbacks.