
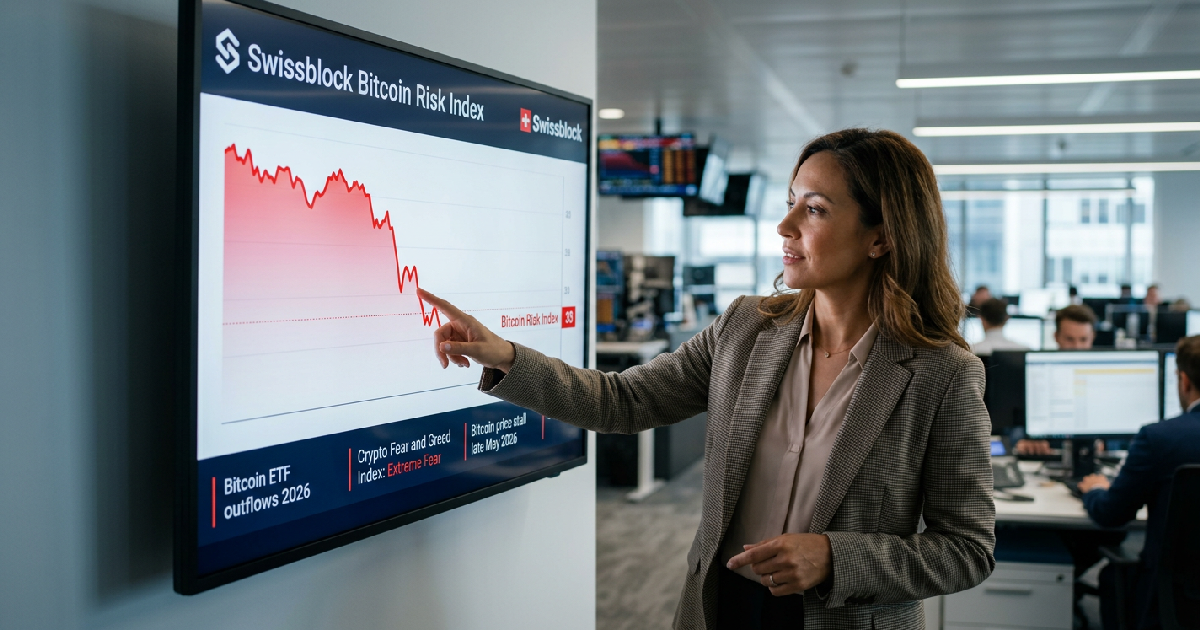

The Bitcoin Risk Index developed by crypto analytics platform Swissblock entered “high-risk territory” on Tuesday, May 26, 2026, as institutional distribution through U.S. spot exchange-traded funds (ETFs) begins to fundamentally outweigh market demand. Swissblock reported that the index reached a score of 33 out of 100, marking a structural change in selling pressure. The shift occurred as Bitcoin price stalled near $77,000 before slipping toward the $75,000 range amid renewed geopolitical tensions between the U.S. and Iran.
According to Swissblock, the current index acceleration suggests that spot Bitcoin ETF demand is no longer effectively absorbing selling pressure. Analysis from on-chain provider Glassnode identifies this as a “persistent institutional sell signal” that has been running for more than two weeks. Since May 7, U.S. spot Bitcoin ETFs have recorded net outflows on nearly every trading day, totaling more than $2 billion in the fortnight leading up to May 25.
This cooling of institutional appetite is a stark departure from the aggressive accumulation seen last year. In 2026, U.S. spot ETFs have absorbed a net of only 4,500 BTC, a significant slowdown. Without strong ETF support to offset the supply side, the market remains vulnerable. This environment mirrors recent Bitcoin price analysis that highlighted the difficulty of sustaining rallies without a recovery in spot demand.
Institutional outflows drive structural shift in market risk
Swissblock noted that every time their Risk Index signals that selling pressure is overwhelming the market, institutional distribution is the primary driver. This trend is corroborated by a threefold increase in exchange inflows. The weekly average of net BTC moving to major exchanges rose to 1,190 BTC in late May, up from just 378 BTC on May 16. As CryptoQuant analyst Darkfost observed, holders moving assets to exchanges often do so with the intent to sell.
The lack of a visible demand offset has left Bitcoin in a precarious consolidation phase. While the asset has shown resilience by holding above $72,000 throughout various drawdowns this month, it has remained largely range-bound for nearly four months. Resistance near the $80,500 level continues to cap upward movement, while the $75,000 to $76,000 range is now viewed as critical support by market participants like MN Capital founder Michaël van de Poppe.
This institutional cautiousness isn’t limited to the top digital asset. Investors are increasingly looking at how these trends affect the wider market, as noted in recent reports on Ethereum support analysis, where similar ETF outflows have weakened the short-term outlook. For Bitcoin, the path to a durable rally now appears dependent on a meaningful recovery in spot demand that has been missing since late 2025.
Market sentiment plunges into extreme fear territory
The convergence of price stalls and technical warnings has severely dented trader confidence. The Crypto Fear & Greed Index fell into “Extreme Fear” territory on Wednesday, May 24, 2026, recording a score of 25 out of 100. This was a notable 10-point drop from the previous session. By May 27, the index remained firmly at 25, reflecting a significant decline from the “fear” territory reading of 37 seen on May 26.
While a reading of 37 is categorized as “fear,” the slide into “extreme fear” (0-24 range) highlights how quickly market psychology has soured. This shift likely stems from Bitcoin’s inability to maintain its footing above $77,000. It also reflects broader anxiety regarding crypto market liquidations as treasury yields and other macro factors pressure risk assets.
Geopolitical volatility and liquidity sweeps
External shocks added to the downward pressure in late May. On May 26, Bitcoin price dropped from above $77,000 to just below $76,500 on Coinbase following reports of strikes by U.S. Central Command on Iranian missile sites. While the military described the action as self-defense, the immediate market reaction was a 1% decline, illustrating the asset’s sensitivity to renewed U.S.-Iran conflict tensions.
Trading data shows that Bitcoin briefly swept liquidity zones as low as $74,100 during these dips. Trader Anup Dhungana noted that BTC reached the May VCPR liquidity zone, suggesting that the “steady drip” of outflows described by Glassnode continues to weigh on the market’s floor. Until the Swissblock Risk Index signals a stabilization of institutional selling, analysts remain wary of further downward volatility.