
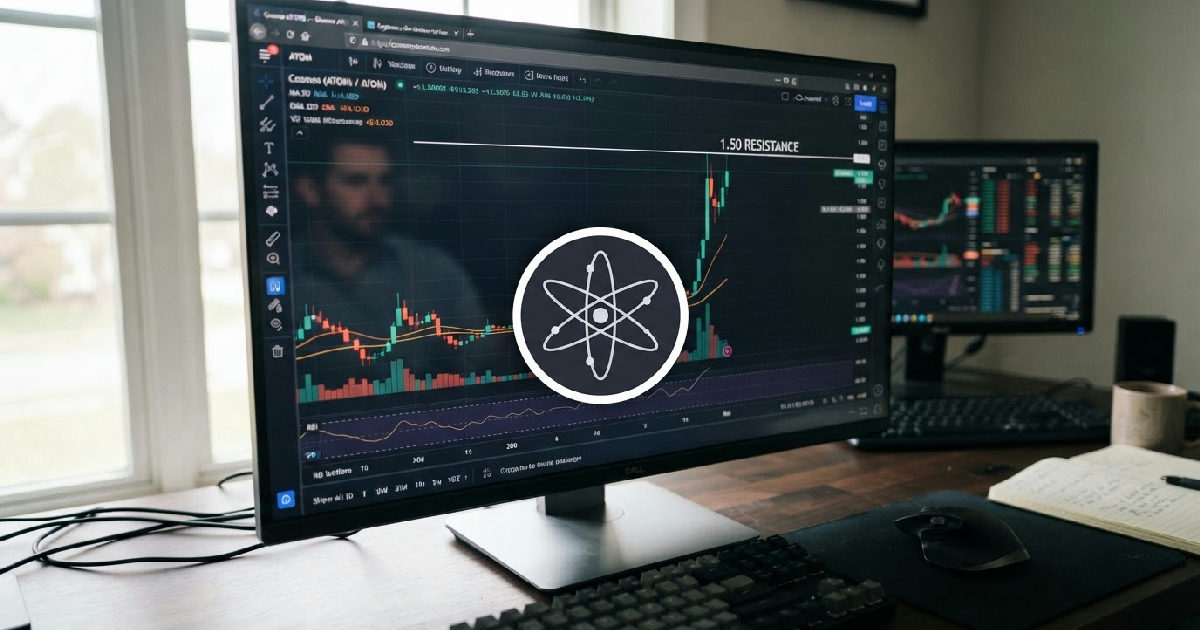

Cosmos ATOM resistance at $1.50 was tested on August 14, 2026, following an 8.3% rally in the past 24 hours. 3% in the past 24 hours to test the crucial $1.50 resistance level as of August 14, 2026. This upward movement, fueled by a substantial surge in trading volume and open interest, has analysts divided.
They’re questioning whether it signifies a potent short squeeze or a deceptive bull trap for the altcoin.
ATOM’s price action follows a prolonged downtrend, having moved from $2.29 down to $1.21 since late May. The current surge represents a considerable rebound, stirring intense speculative activity across the market.
Cosmos ATOM sees sharp rally and increased speculation
Cosmos ATOM’s recent performance highlights a dramatic shift in market dynamics. The token’s price increased by 8.3% over the last 24 hours, accompanied by a staggering 91.9% surge in daily trading volume. This suggests a strong influx of capital into the altcoin.
Further evidence of heightened interest comes from an 11.3% climb in Open Interest over the same period. This metric tracks the total number of outstanding derivative contracts, indicating heavy speculative trading. The spot Cumulative Volume Delta (CVD) also spiked, confirming robust spot demand.
Conflicting technical signals emerge for ATOM
Technical indicators present a mixed picture for Cosmos ATOM’s immediate future. A bullish crossover of moving averages has formed, with the price now trading above these key trend lines. This typically signals strengthening bullish momentum for traders.
The Moving Average Convergence Divergence (MACD) indicator is also climbing towards the zero line. This move suggests a weakening of previous bearish momentum and points toward a potential recovery. Additionally, the Chaikin Money Flow (CMF) has broken past the +0.05 mark, indicating strong capital inflows into ATOM.
But not all signals align with a bullish outlook. The 14-day Relative Strength Index (RSI) stands at 87, signaling seriously overbought conditions. Such a high RSI reading often precedes a short-term price pullback, as buyers may be exhausted.
Moreover, the 4-hour chart structure for ATOM remains bearish despite the recent rally. This short-term timeframe suggests underlying weakness that could quickly resurface.
Short squeeze or bull trap: The core debate
The central question gripping Cosmos (ATOM) traders right now is whether the rally marks a genuine short squeeze or a looming bull trap. A short squeeze occurs when a rapid price increase forces short sellers to buy back assets to limit losses, further fueling the rally. A bull trap, conversely, is a false recovery that lures buyers in before the price reverses downwards.
Arguments for a short squeeze are compelling. The rally successfully swept a significant cluster of short liquidations around the $1.50 area, according to the 1-month liquidation heatmap. This forced many short positions to close, contributing to the upward pressure.
The robust trading volume and spot CVD spike also support the short squeeze narrative, indicating genuine buying interest. Analysts also attribute some of the price climb to fundamental improvements within the Cosmos ecosystem, including significant Cosmos Hub upgrades like Liquid Staking (LSM) and the expansion of Interchain Security (ICS).
These upgrades are designed to enhance the utility and security of the Cosmos network. This strengthens the argument for a sustained, fundamentally driven rally. ATOM’s significant outperformance against Bitcoin, registering a 7.51% stronger rise compared to Bitcoin’s modest 0.56% increase, further supports its decoupled “strong alpha” status.
However, the case for a bull trap remains strong. A negative funding rate for ATOM derivatives is a clear warning sign for bulls. It indicates that short positions are willing to pay a premium to maintain their bearish bets, suggesting the market broadly anticipates a price reversal.
The token is currently trading within its “golden pocket” of Fibonacci retracement levels, specifically between $1.46 and $1.53. Technical analysis based on this structure anticipates a rejection from the $1.50 resistance zone. The bearish structure on the 4-hour chart further reinforces this cautious outlook.
Understanding Cosmos and its ecosystem
Cosmos is a blockchain platform designed to facilitate interoperability between different blockchains. It aims to create an “Internet of Blockchains” where various ledgers can communicate and exchange data seamlessly. Its native token, ATOM, plays a crucial role in securing the network and enabling governance.
Introduced in a white paper by Tendermint co-founders Jae Kwon and Ethan Buchman in 2016, Cosmos held private and public sales for ATOM in 2017. The Inter-Blockchain Communications (IBC) protocol, a cornerstone of its interoperability vision, launched in April 2021. This technology allows independent blockchains to securely transfer tokens and other data to one another.
Recent upgrades, such as Liquid Staking (LSM) and the expansion of Interchain Security (ICS), enhance both network participation and overall security. These developments could fundamentally improve ATOM’s long-term value proposition. They provide a deeper context to the current speculative price movements.
Outlook for Cosmos ATOM
The immediate future for Cosmos ATOM hinges on its ability to decisively breach the $1.50 resistance level. Despite the recent bullish momentum, technical forecasts suggest ATOM will likely struggle to clear this supply zone. A sustained push above $1.62 is crucial to signal a potential rally toward the psychological $2 mark.
Should ATOM fail to hold its ground, a bearish trend continuation appears likely. Analysts are watching the $1.47 level closely; a break below it could see the token retesting the $1.39–$1.40 support zone. Below that, strong support rests at $1.33 and major support at $1.27.
The current market sentiment remains a tug-of-war between short-term bullish indicators and underlying bearish structural warnings. The resolution of this $1.50 resistance test will likely determine ATOM’s trajectory in the coming days and weeks. Market participants will be looking for clear signs of either sustained buying pressure or a decisive rejection from this critical price point.